Occasionally, I work on non-commercial projects with the community in mind. There's this simple tool called Meetup that helps you schedule meetups with your friends. There's Project Traffic Observer, a service that monitors bus arrival times to check if certain roads are congested. There was Project Lend-A-Hand, which offers free IT services to Voluntary Welfare Organisations (VWOs) back in Apr 2019.
Posted on 29 February 2020 at 12:30pm

I have been working on a Graph on COVID-19 cases in Singapore.
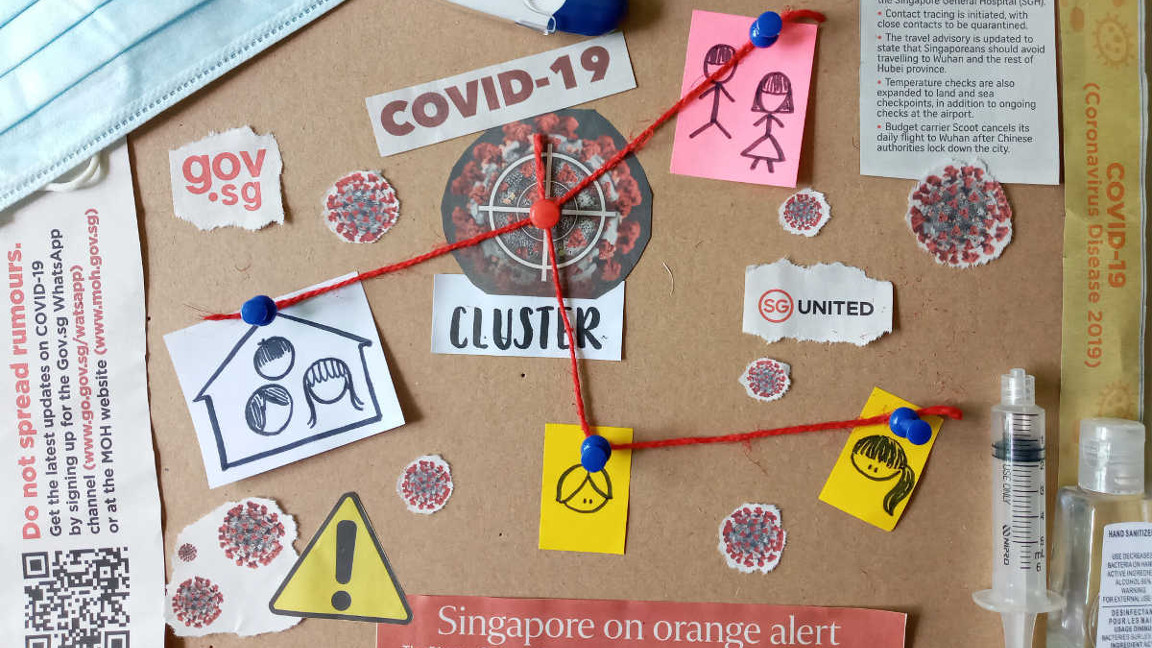
It started when I was trying to keep up with the daily updates from the Ministry of Health (MOH). At some point, it became pretty confusing "who is linked to who and where" so I created a graph to help me visualise the relationships. Over time, I added filter and search functions to make it easier and quicker to find information about the cases and clusters.
You can explore the graph at https://www.maventechnologies.com.sg/covid-19.
If you are keen on the details in building and maintaining this graph, read A Graph on COVID-19 cases in Singapore.
I hope it complements the other tools and infographics contributed by the various agencies and individuals, and helps the local community stay updated in this battle against the virus.